
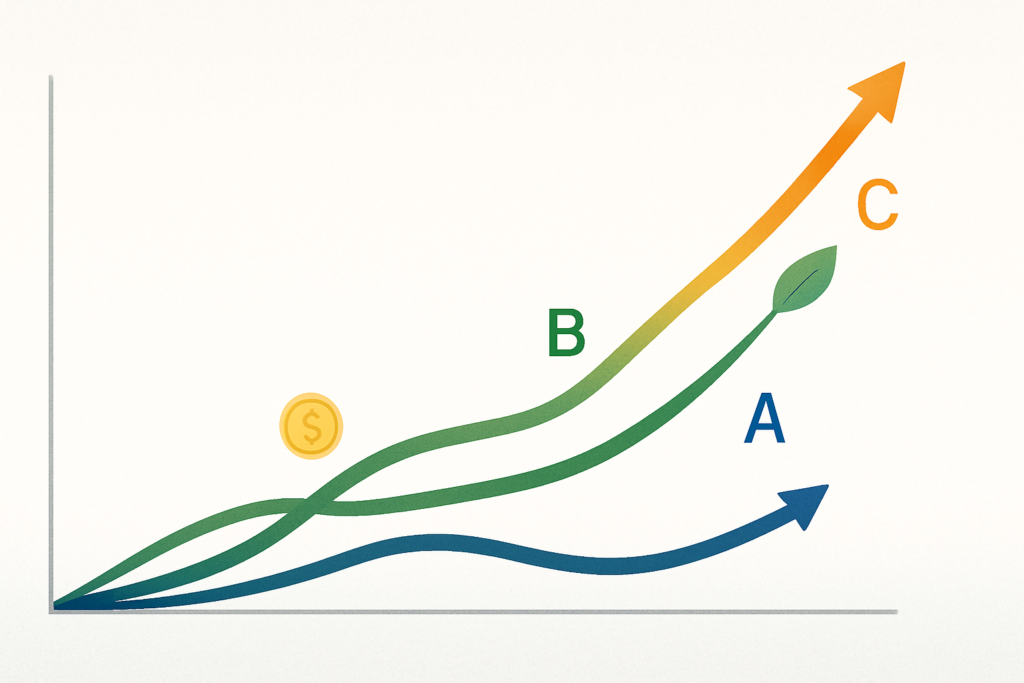
The most popular dividend ETF in America right now isn’t SCHD or VYM. It’s JEPI — the JPMorgan Equity Premium Income ETF — which has attracted over $35 billion in assets largely because of its eye-catching yield. At various points, JEPI has yielded 7, 8, even 9 percent annually. When you’re 55 and watching your 401(k) swing up and down, that kind of number gets attention.
Here’s the uncomfortable reality: for most 55-year-olds who are still accumulating wealth and are 8 to 12 years from actually needing the income, JEPI is probably the wrong choice. A high yield today often comes at the cost of lower total return tomorrow — and when you’re a decade from retirement, what you actually need is growth plus eventual income, not maximum income right now at the expense of everything else.
I spent most of my career as a Warning Coordination Meteorologist at the National Weather Service — a job that’s fundamentally about reading what the data says versus what a particular outcome looks like on the surface. The highest yield in a portfolio looks exactly like the brightest color on a radar screen. It gets everyone’s attention. It doesn’t always tell you what you think it tells you.
What SCHD Actually Is
SCHD stands for Schwab US Dividend Equity ETF. It tracks the Dow Jones US Dividend 100 Index — 100 US stocks selected for a combination of dividend yield, dividend growth history, cash flow-to-debt ratio, return on equity, and dividend-to-share-ratio. It’s not simply the 100 highest-yielding stocks. It screens for financial quality before it screens for yield, which is a meaningful distinction.
The resulting portfolio holds blue-chip US dividend payers: Home Depot, Chevron, Cisco, Amgen, Verizon, Lockheed Martin, Pfizer, and similar companies. Sector-heavy in financials, healthcare, energy, and industrials. Notably light on technology relative to the S&P 500 — which is why it lagged the total market during the 2020-2021 tech surge and then held up considerably better in the 2022 correction.
Current yield: roughly 3.3 to 3.7 percent depending on the entry point. Expense ratio: 0.06 percent annually. And here’s the number that matters most for a 55-year-old with a decade until retirement: SCHD’s dividend has grown at a historical rate of roughly 9 to 11 percent per year over its existence. That compounding matters enormously. A dividend that starts at 3.5 percent and grows 10 percent annually doubles as a percentage of your original investment in about seven years.
What VYM Actually Is
VYM stands for Vanguard High Dividend Yield ETF. It tracks the FTSE High Dividend Yield Index, which is simpler in construction than SCHD’s methodology — it selects stocks with above-average forecast dividends, weighted by market cap. No financial quality screen. Just: are the dividends expected to be above average?
This produces a broader portfolio of roughly 400+ stocks, with a lower concentration in any single holding. Where SCHD’s top holdings might represent 30 to 40 percent of the fund, VYM is more diluted. More diversified in some ways, but the lack of a quality screen means it holds some weaker businesses alongside the strong ones.
Current yield: approximately 3.0 to 3.3 percent. Expense ratio: 0.06 percent. Dividend growth rate: lower than SCHD historically, roughly 5 to 8 percent annually. Total return has been competitive with SCHD over long periods, but SCHD has generally edged it out in most rolling 5 and 10-year windows.
What JEPI Actually Is (And Why It’s Different)
JEPI is categorically different from SCHD and VYM. It’s not a dividend growth fund. It’s an options income fund that generates its yield through a covered call strategy rather than traditional dividend payments.
Here’s how it works: JEPI holds a defensive-leaning equity portfolio and simultaneously sells equity-linked notes tied to S&P 500 options. When the market rises, those options get exercised by the buyers and JEPI captures the premium income instead of the full upside. When the market falls, the options expire worthless but JEPI retains the premium — providing partial downside cushion. The monthly distributions this generates look like dividends but are legally structured differently and taxed differently.
The result: JEPI produces a higher current yield — often 7 to 9 percent — but gives up significant upside participation in strong market years. In 2023, when the S&P 500 returned roughly 26 percent, JEPI returned around 8 to 9 percent total. In 2022’s downturn, JEPI held up considerably better than the index. If you’re in retirement and need that monthly income right now and want lower volatility, JEPI’s profile makes sense. If you’re 55 and still growing, capping your upside at 8 to 9 percent in bull markets is a serious cost.
The tax treatment is another issue. Most of JEPI’s distributions are classified as ordinary income rather than qualified dividends. Qualified dividends are taxed at 0, 15, or 20 percent depending on your income level — a significant advantage over ordinary income rates that can run 22 to 32 percent. SCHD and VYM pay primarily qualified dividends. JEPI largely does not. That tax drag matters significantly if JEPI is held in a taxable account.
The Side-by-Side Comparison
Let’s put numbers on this for a 55-year-old with $150,000 already invested in dividend ETFs and 10 years to retirement.
Scenario 1 — SCHD: 3.5% starting yield, 10% annual dividend growth, 9% estimated total annualized return over 10 years (historical ballpark). After 10 years, the dividend yield on original cost roughly doubles. $150,000 grows to approximately $355,000 at 9% CAGR. Annual dividend income at 3.5% on $355,000 = about $12,400.
Scenario 2 — VYM: 3.1% starting yield, 6% dividend growth, 8% estimated total annualized return. After 10 years, $150,000 grows to approximately $323,000. Annual dividend income at 3.1% = roughly $10,000.
Scenario 3 — JEPI: 8% starting yield, minimal distribution growth (options premiums fluctuate with volatility), 7 to 8% estimated total annualized return in average markets. After 10 years at 7.5%, $150,000 grows to approximately $309,000. You’ve been collecting $12,000/year in distributions meanwhile — but those were taxed at ordinary income rates rather than preferential dividend rates, and you sacrificed the compounding growth that SCHD or VYM would have generated in strong market years.
The conclusion isn’t that JEPI is bad. It’s that JEPI is optimized for a different moment in the investing lifecycle than age 55 with a decade of runway remaining.
Where Each Fund Belongs in Your Portfolio
Account type matters enormously for dividend ETFs. The dividend-versus-total-return debate often pivots on whether you’re in the accumulation phase or the distribution phase — and the answer changes where you hold each fund.
SCHD in a Roth IRA: excellent choice. The dividend growth compounds tax-free. When you eventually take distributions in retirement, neither the dividends nor the growth are taxed. This is the most powerful version of the SCHD thesis.
SCHD in a taxable account: workable but requires attention. The qualified dividends are taxed at preferential rates, so the tax drag is manageable. Just don’t expect to reinvest those dividends without a small tax bill each year.
VYM in a taxable account: similar to SCHD. Qualified dividends, low expense ratio, manageable tax situation. Slightly lower quality screen means slightly lower expected return over time.
JEPI in a taxable account: the worst place for it. Ordinary income tax treatment on distributions in a taxable account turns an 8% yield into a 5 to 6% effective yield for someone in the 22 to 24 percent bracket. If you want JEPI, put it in a traditional IRA or 401(k) where the ordinary income treatment is irrelevant — you’ll owe tax on withdrawals anyway regardless of how the income was generated inside the account.
What a 55-Year-Old Should Actually Do
Here’s my direct take: at 55 with 10 years until retirement, SCHD belongs in your Roth IRA and, if you hold it in a taxable account, you accept the modest dividend tax in exchange for the dividend growth. VYM is a reasonable alternative or complement — it adds breadth and reduces concentration. JEPI deserves at most 10 to 15 percent of a dividend-focused portfolio at this stage, held inside a tax-advantaged account, as a volatility buffer rather than a core growth engine.
The mistake I see consistently: people allocating heavily to JEPI at 55 because 8% looks better than 3.5%. What they’re really doing is trading long-term growth for current income they don’t yet need. That’s the wrong sequence. The time to maximize income distributions is when you’re spending them, not 10 years before.
This is similar to the structure question I covered when writing about VTSAX versus VTI — total market fund decisions often come down to account type and whether you want automatic reinvestment or manual control over distributions, not raw performance. The same framework applies here.
The Amazon Shelf Worth Having
If you want to go deeper on building a dividend portfolio before and through retirement, Dividends Still Don’t Lie by Kelley Wright makes the quality-first case for dividend investing in a way that maps well onto why SCHD’s methodology works. For the broader income-generating framework — including when to shift from growth to distribution mode — The Simple Path to Wealth by JL Collins gives you the structural foundation before you get into the three-fund vs. dividend ETF debate.
The Action Step
If you don’t yet hold SCHD and want to evaluate it against your current holdings, Schwab’s ETF comparison tool at schwab.com lets you overlay SCHD, VYM, and JEPI side-by-side on total return, yield history, and sector exposure. Run the 5-year total return chart and the 3-year dividend growth chart before deciding how much weight to give each. The yield number alone will mislead you. The total return chart, including distributions, won’t.